

Full-AreaPL Imaging
Absolute luminescence mapping over large areas
LuQY Scanner brings quantitative luminescence analysis to full wafers and large-area devices. It combines rapid PL imaging with absolute PLQY and QFLS mapping, revealing spatial variations across samples up to 21 × 21 cm (G12 wafer). Automated measurements transform complex luminescence data into intuitive maps for fast evaluation and optimization.

Overview
LuQY Scanner extends the capabilities of LuQY Pro to spatially resolved characterization over large areas. It combines full-area luminescence imaging, automated positioning along the X, Y and Z axes, absolute light collection and spectral analysis in a single integrated system for thin films, layer stacks, wafers and complete optoelectronic devices up to 21 × 21 cm.
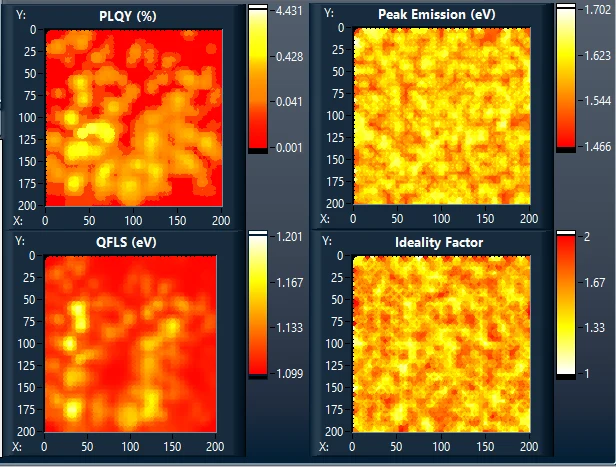
The system measures photoluminescence quantum yield (PLQY) and determines the quasi-Fermi level splitting, commonly expressed as QFLS or implied open-circuit voltage (iVOC), at defined positions across the sample surface. With the optional SMU configuration, it can also perform absolute electroluminescence measurements and determine ELQY under controlled electrical operating conditions. The individual results are combined into quantitative maps that reveal spatial variations in radiative efficiency, QFLS, peak emission energy and other calculated parameters.
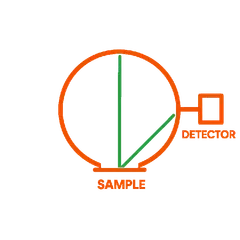
At the start of a measurement, the system records a full-area PL image of the sample. Individual measurement points, selected regions or complete grids can then be defined directly on the image. After automatic height calibration, the motorized measurement head moves through the selected positions. At each position, the sample is excited by a controlled laser source, while the emitted light is collected by an integrating sphere and analyzed by a spectrometer. The LuQY Control software coordinates positioning, data acquisition, calculation and map generation automatically.
The complete workflow, from full-area imaging and measurement planning through point-by-point acquisition and spatial data visualization, is designed to minimize manual steps and improve measurement reproducibility. Individual measurements can be completed rapidly, while the total mapping time remains determined by the selected grid, integration time and measurement routine.
LuQY Scanner can characterize a single large-area sample or multiple smaller samples within the same measurement area. Its combination of overview imaging and quantitative local measurements makes it suitable for uniformity analysis, process development, device comparison and advanced research workflows where spatially resolved and reproducible luminescence data are required.
Transform raster measurements into quantitative heatmaps and statistical distributions of PLQY, QFLS, peak emission and ideality factor.
Use results immediately, connect existing infrastructure, or integrate LuQY Scanner into automated research workflows.
Measurement result files are generated automatically for immediate analysis, archiving or sharing.
Store results directly in your existing database infrastructure.
Connect results to QYB Lab or NOMAD Oasis for structured data management and research workflows.
Complete optical unit calibrated with a NIST-traceable reference source.
Every system is tested and commissioned by QYB.
Measurement and analysis methods supported by peer-reviewed literature.
Every LuQY Scanner is individually tested and calibrated by QYB before delivery. The integrating sphere and spectrometer are calibrated as a complete measurement unit using a NIST-traceable reference source to support consistent and reproducible absolute measurements.
The system is designed in accordance with applicable European electrical, electromagnetic compatibility and laser safety requirements.
LuQY Scanner is built on measurement and analysis methods established through fundamental scientific research and peer-reviewed literature. The system supports specialists investigating photovoltaic and optoelectronic materials, identifying recombination losses and developing advanced devices.
Specifications
| Parameter | Specification |
|---|---|
| Measurement | |
| Measurement modes | Absolute photoluminescence and electroluminescence |
| Spatial measurement modes | Single-point measurement, selected-area mapping and automated full-area raster mapping |
| Calculated results | PLQY, ELQY, QFLS / iVOC and peak emission energy |
| Advanced calculated results | Ideality factor, pseudo-fill factor and pseudo-JV curves from automated excitation-intensity sweeps |
| Mapping results | Spatial heatmaps and histograms of PLQY, ELQY, QFLS / iVOC, peak emission energy, ideality factor and other calculated parameters |
| Minimum resolvable luminescence quantum yield | 10⁻⁶ (0.0001%) |
| Spectrometer integration time | 1 ms–35 min |
| Spectral sampling interval | 1 nm |
| Signal-to-noise ratio | 600:1 |
| Acquisition modes | Averaged or continuous spectral acquisition |
| Measurement automation | Automated height calibration, imaging, point positioning, spectral acquisition and result calculation |
| Large-Area Mapping | |
| Maximum mapping area | 210 × 210 mm for one large-area sample or an array of smaller samples |
| Maximum sample height | 50 mm |
| Supported sample configurations | One large-area sample or multiple smaller samples arranged on the sample stage |
| Positioning system | Fully motorized X–Y positioning |
| Mapping principle | Automated point-by-point absolute luminescence measurement |
| Measurement selection | Individual points, rectangular regions or complete user-defined grids |
| Grid spacing | User configurable |
| Measurement sequence | Automatically generated and editable measurement queue |
| Height handling | Automatic sample-height calibration |
| Position selection | Measurement positions can be selected directly on the full-area luminescence image |
| Automated workflow | Height calibration, full-area imaging and execution of all configured mapping points |
| Full-Area Luminescence Imaging | |
| Imaging modes | Full-area photoluminescence imaging; electroluminescence imaging with optional electrical excitation |
| Imaged area | Complete sample-stage area up to 210 × 210 mm |
| Exposure control | Automatic or manual |
| Primary purpose | Rapid visualization of luminescence variations across the complete sample surface |
| Measurement-point definition | Points and mapping regions can be selected directly on the PL or EL image |
| Image integration | Image coordinates are linked to the measurement queue, spectra and calculated heatmaps |
| Optical Excitation and Spectral Detection | |
| Excitation wavelength | |
| Compatible spectral detection range | 550–1050 nm |
| Photoexcitation intensity | 0.001–10 suns equivalent, continuously adjustableThe achievable equivalent-sun intensity may depend on the sample absorption, band gap, selected excitation wavelength and selected spot size. |
| Excitation spot size | Configurable from 0.1 cm² to 1.3 cm² |
| Spectrometer integration time | 1 ms–35 min |
| Spectral sampling interval | 1 nm |
| Signal-to-noise ratio | 600:1 |
| Sample Handling | |
| Maximum sample dimensions | 210 × 210 × 50 mm |
| Supported sample types | Thin films, layer stacks, wafers and complete optoelectronic devices |
| Sample arrangement | One large sample or multiple smaller samples |
| Sample stage | Motorized and height adjustable |
| Height calibration | Automatic |
| Sample holder | Customizable |
| Loading access | Front sample compartment with safety-interlocked door |
| Measurement chamber | Fully enclosed |
| Software and Automation | |
| Quick measurement workflow | Automatic height calibration, full-area luminescence imaging and execution of the prepared measurement map. |
| Live result visualization | Spectra, PL/EL images, calculated values, heatmaps and histograms |
| Data export | Automatically generated measurement files |
| Database integration | Supported |
| Report generation | Automated PDF report generation |
| Advanced data analysis | QYB Lab and NOMAD integration |
| System | |
| Dimensions (W × D × H) | Approx. 400 × 400 × 600 mm |
| Weight | Up to 16 kg |
| Computer connection | USB 3.0 |
| Power connection | 24 V DC |
More system details
| |
| Calibration | |
| Excitation calibration | Calibrated against certified reference solar cells |
| Spectral calibration | NIST-traceable reference source |
| Recommended calibration interval | 1 year |
Optional extensions
Adds controlled electrical excitation for absolute electroluminescence measurements, EL imaging, ELQY and QFLS analysis.
Available with dedicated electrical sample holders and customizable contact configurations.Applications · LuQY Pro
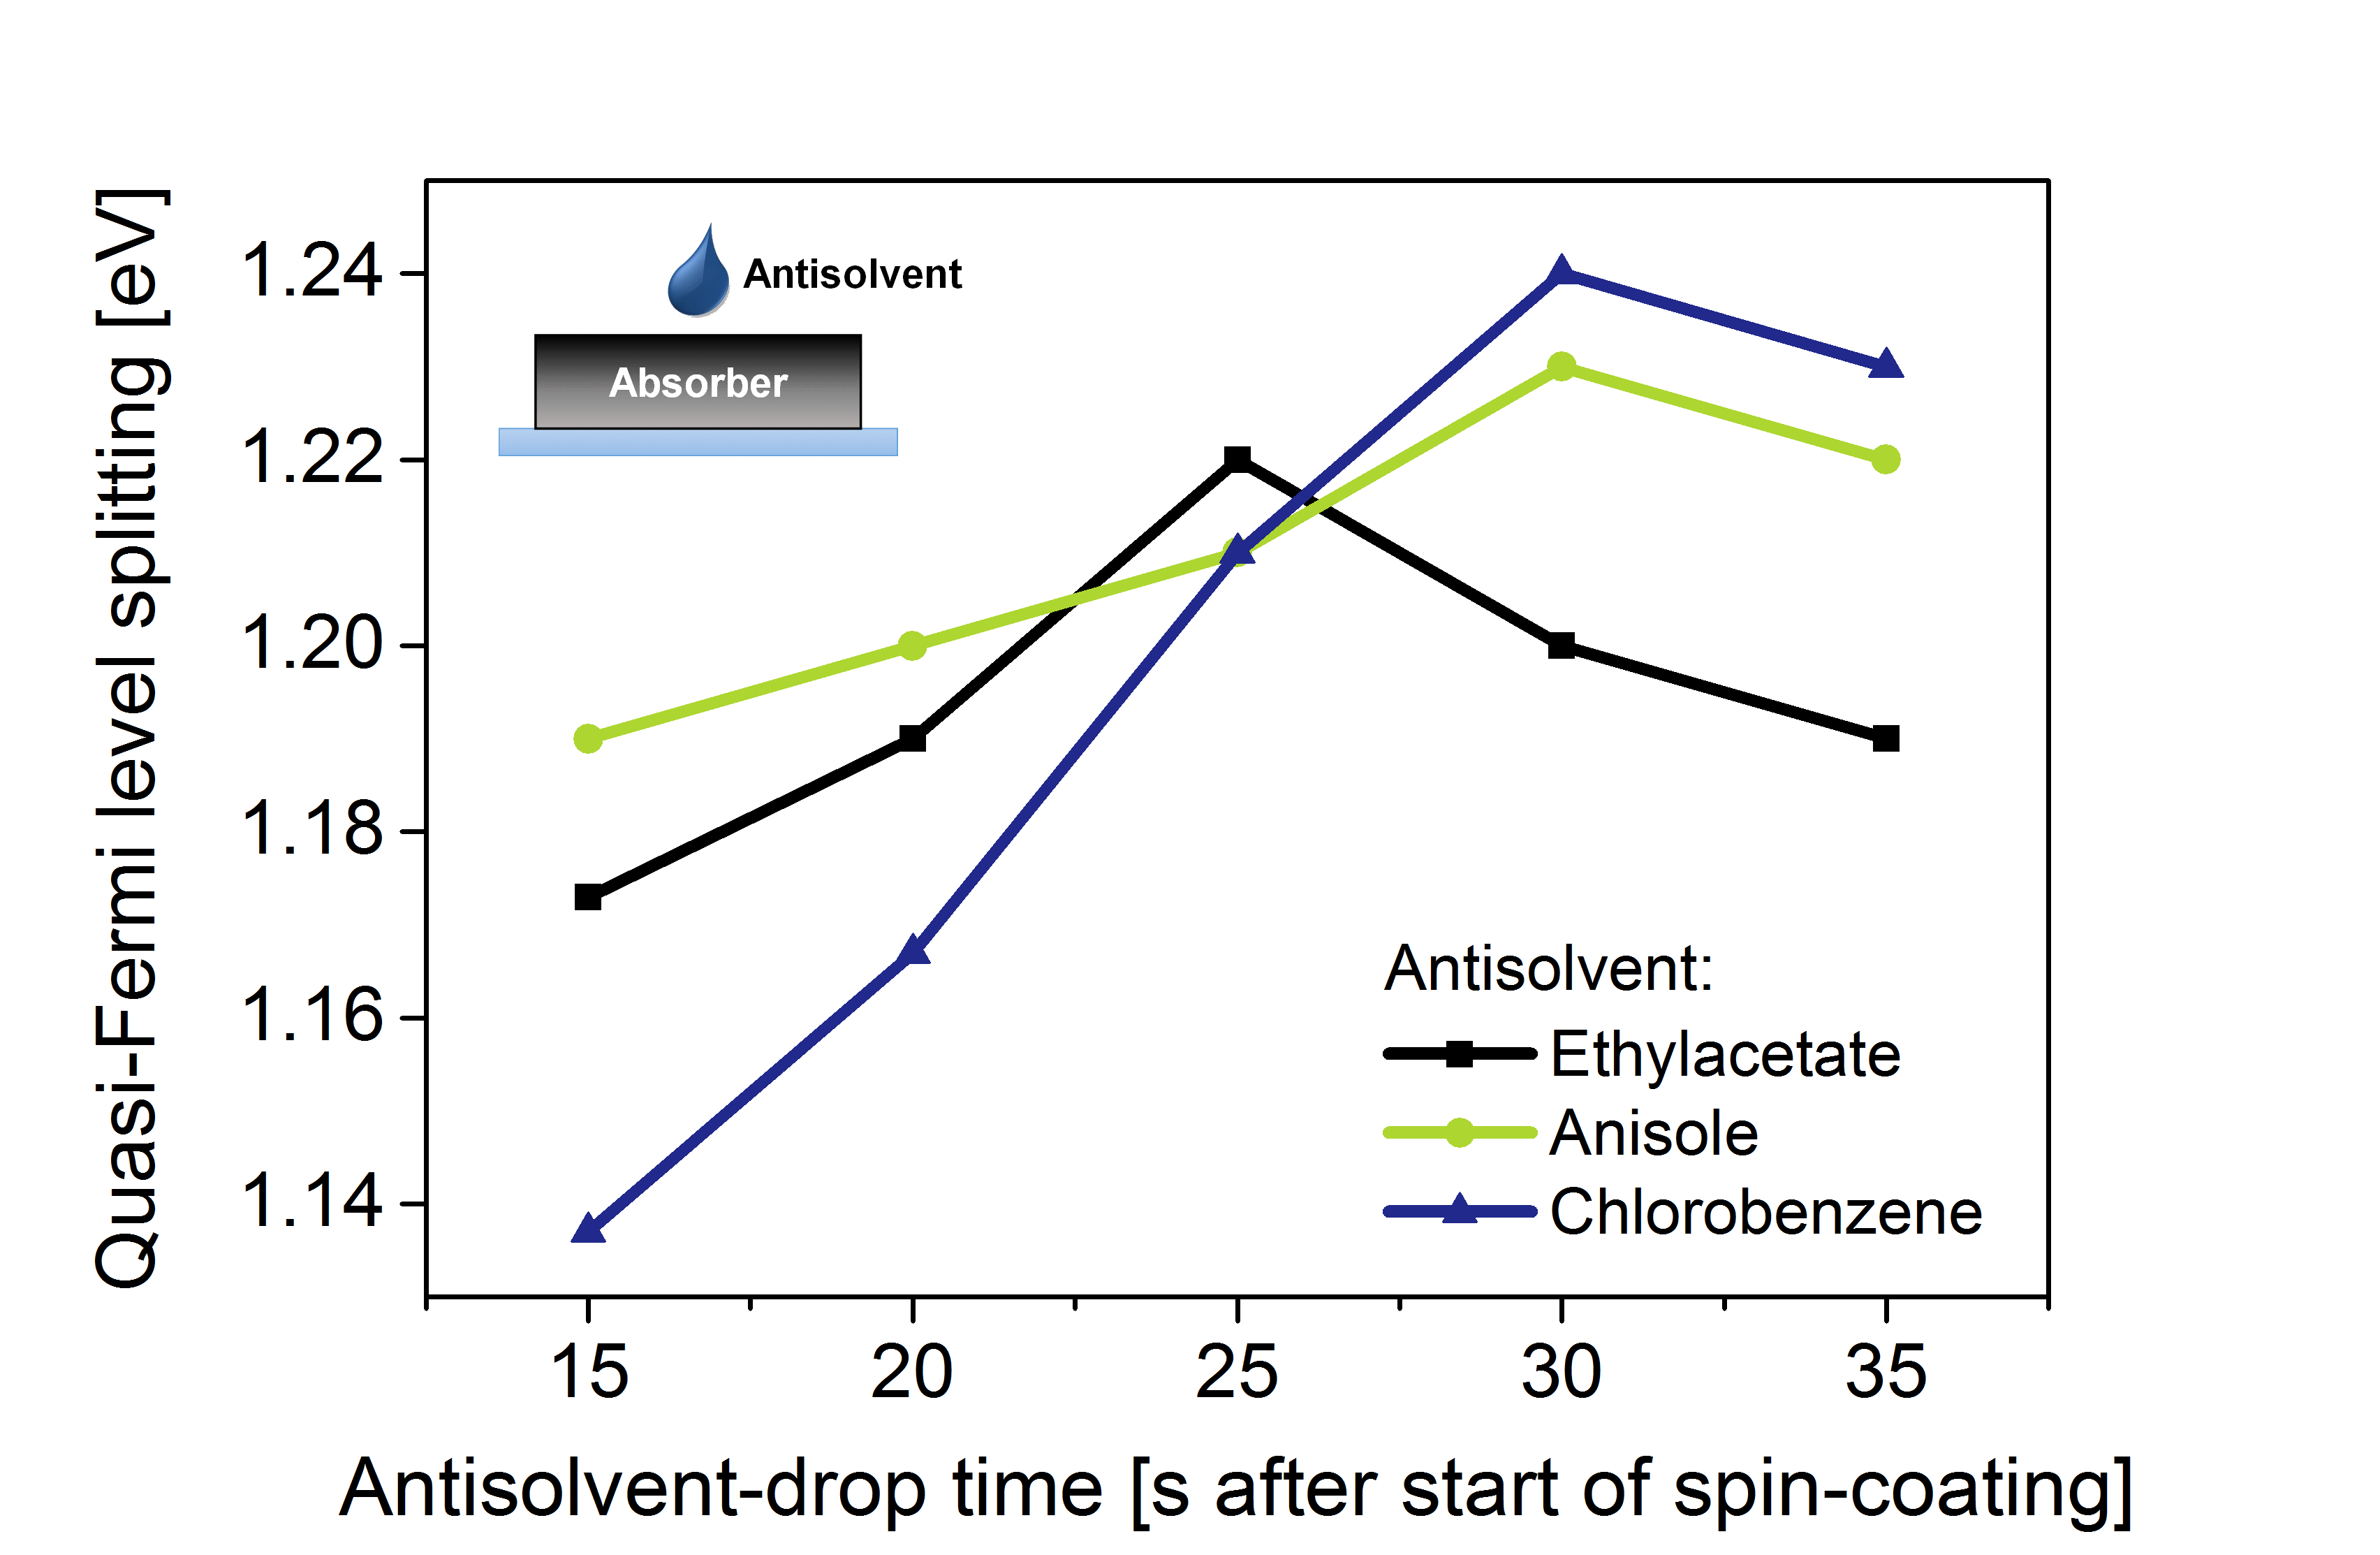
Quality assessment for rapid process control after each fabrication step or for accelerated material and process parameter screenings.
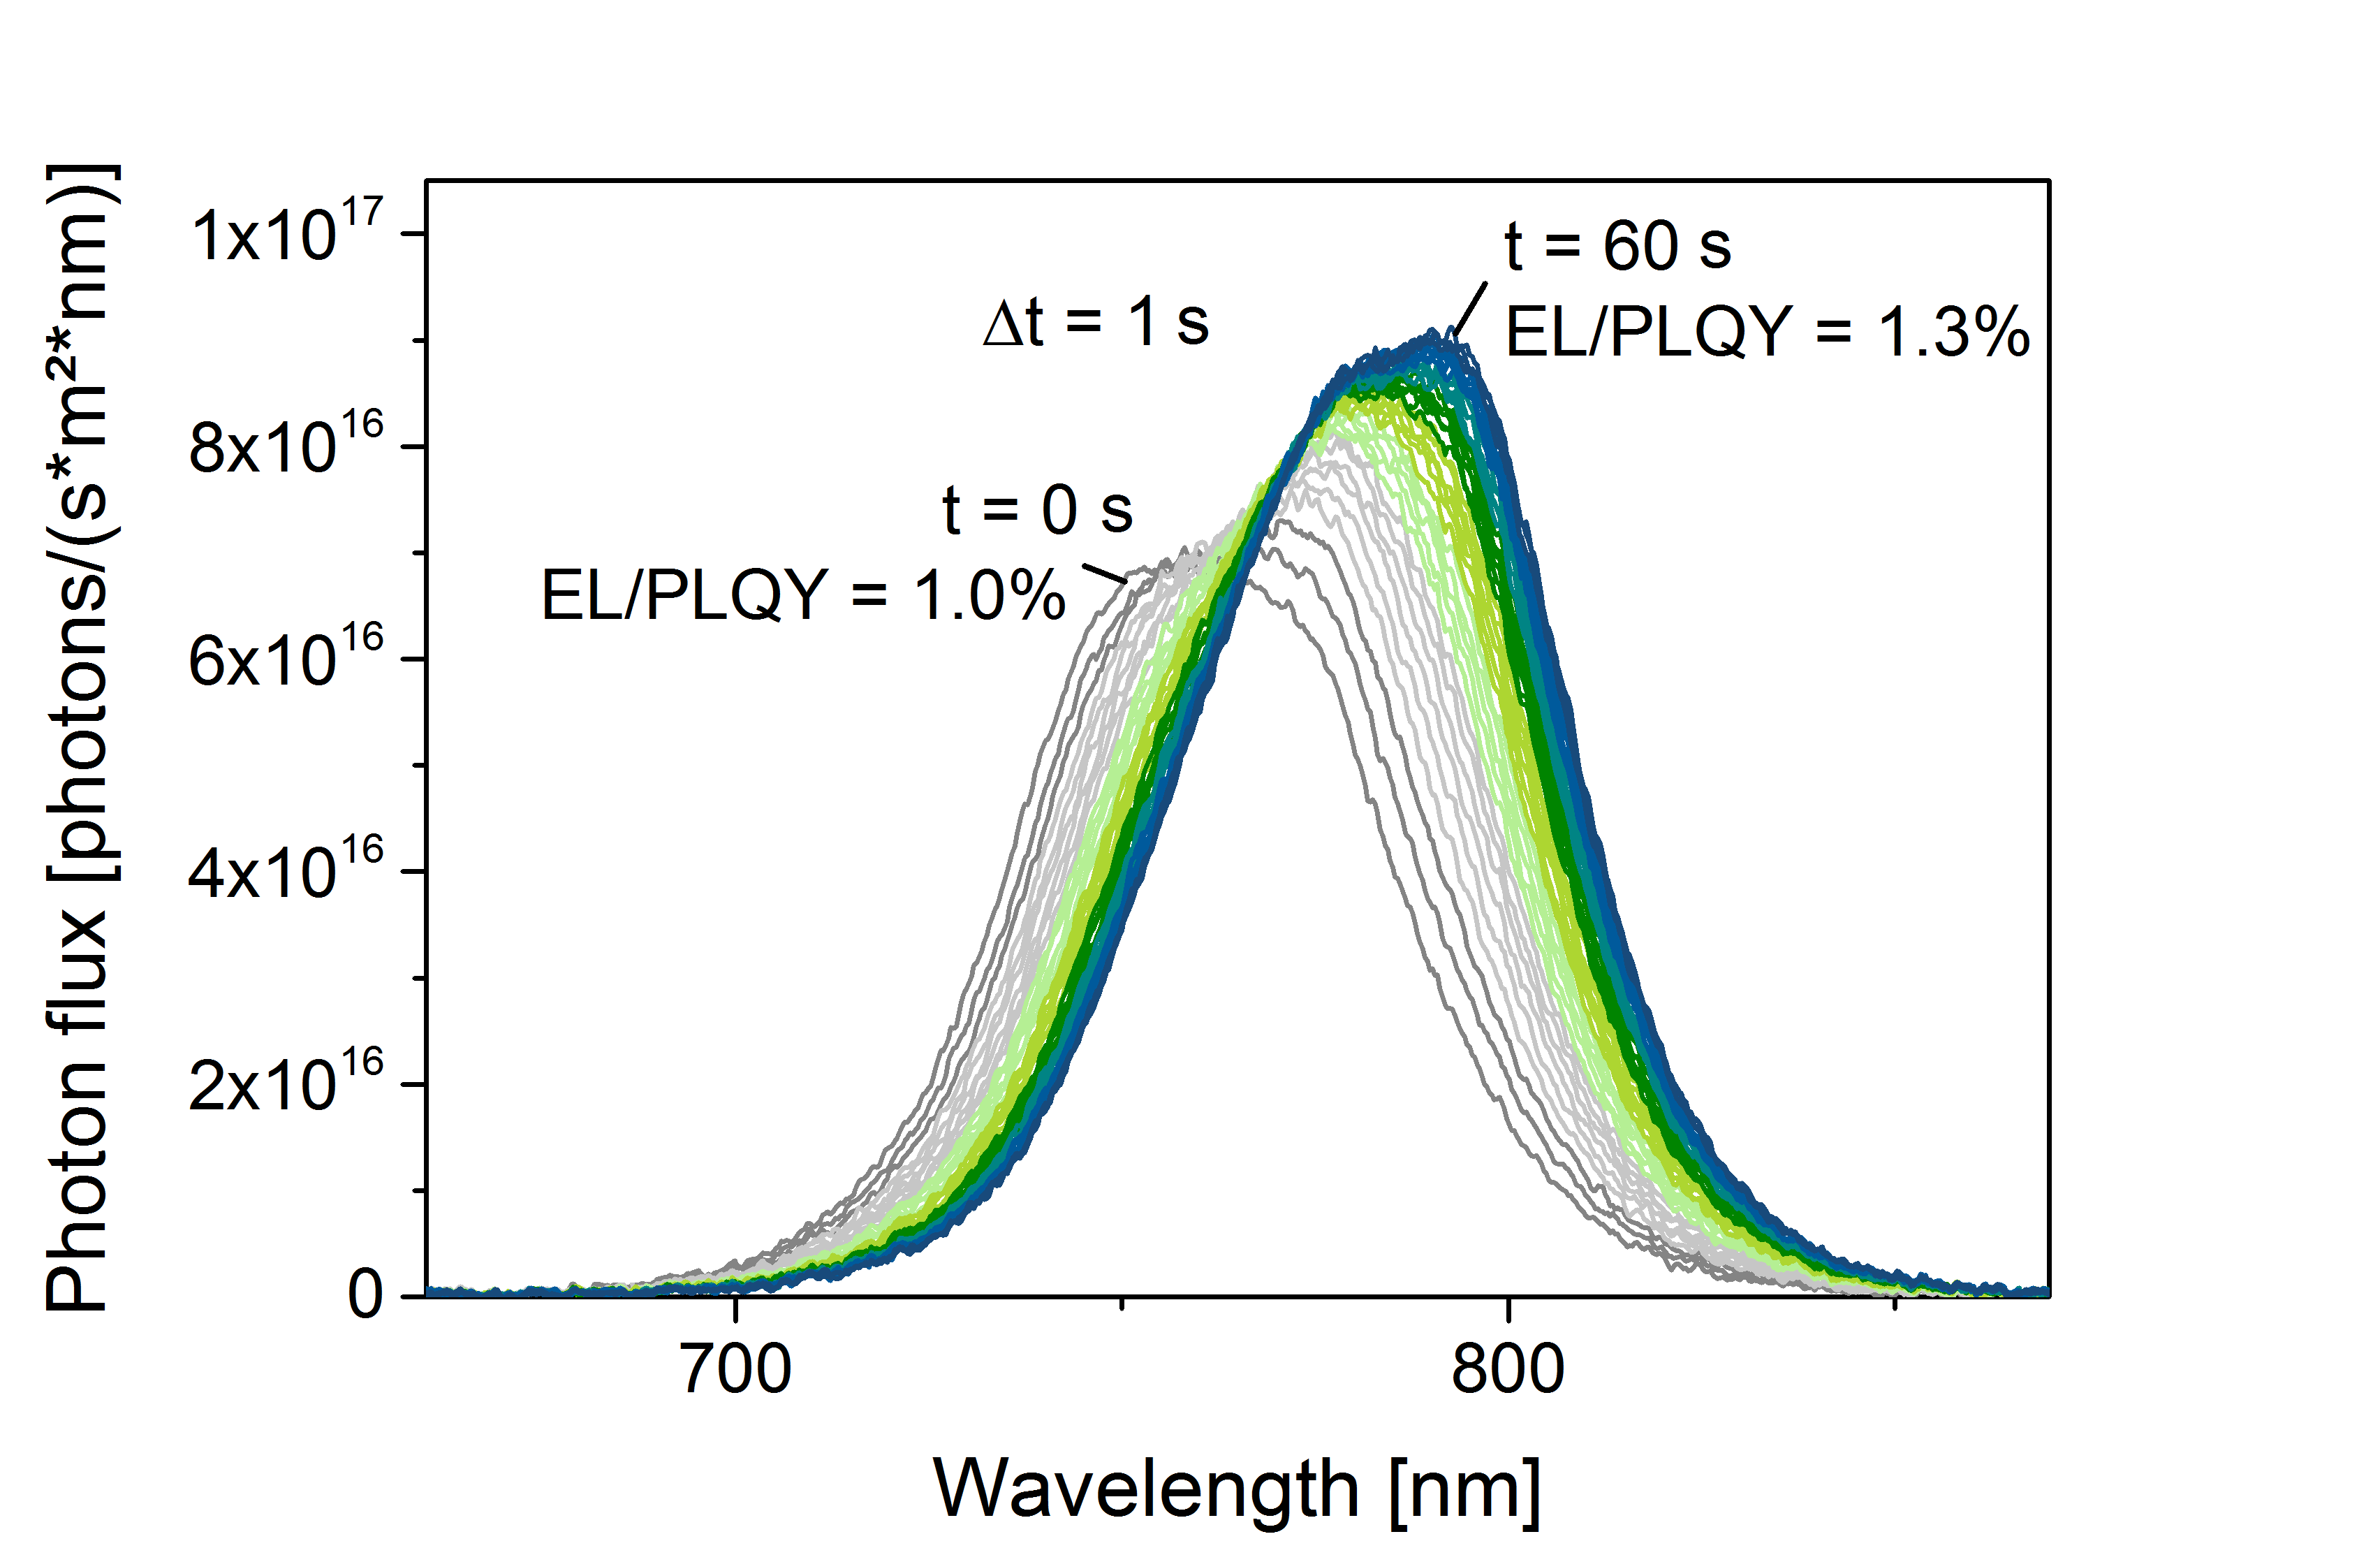
Fast acquisition resolves shifts in emission spectrum and intensity, as well as EL / PLQY and QFLS, on timescales from 10 ms to several hours.
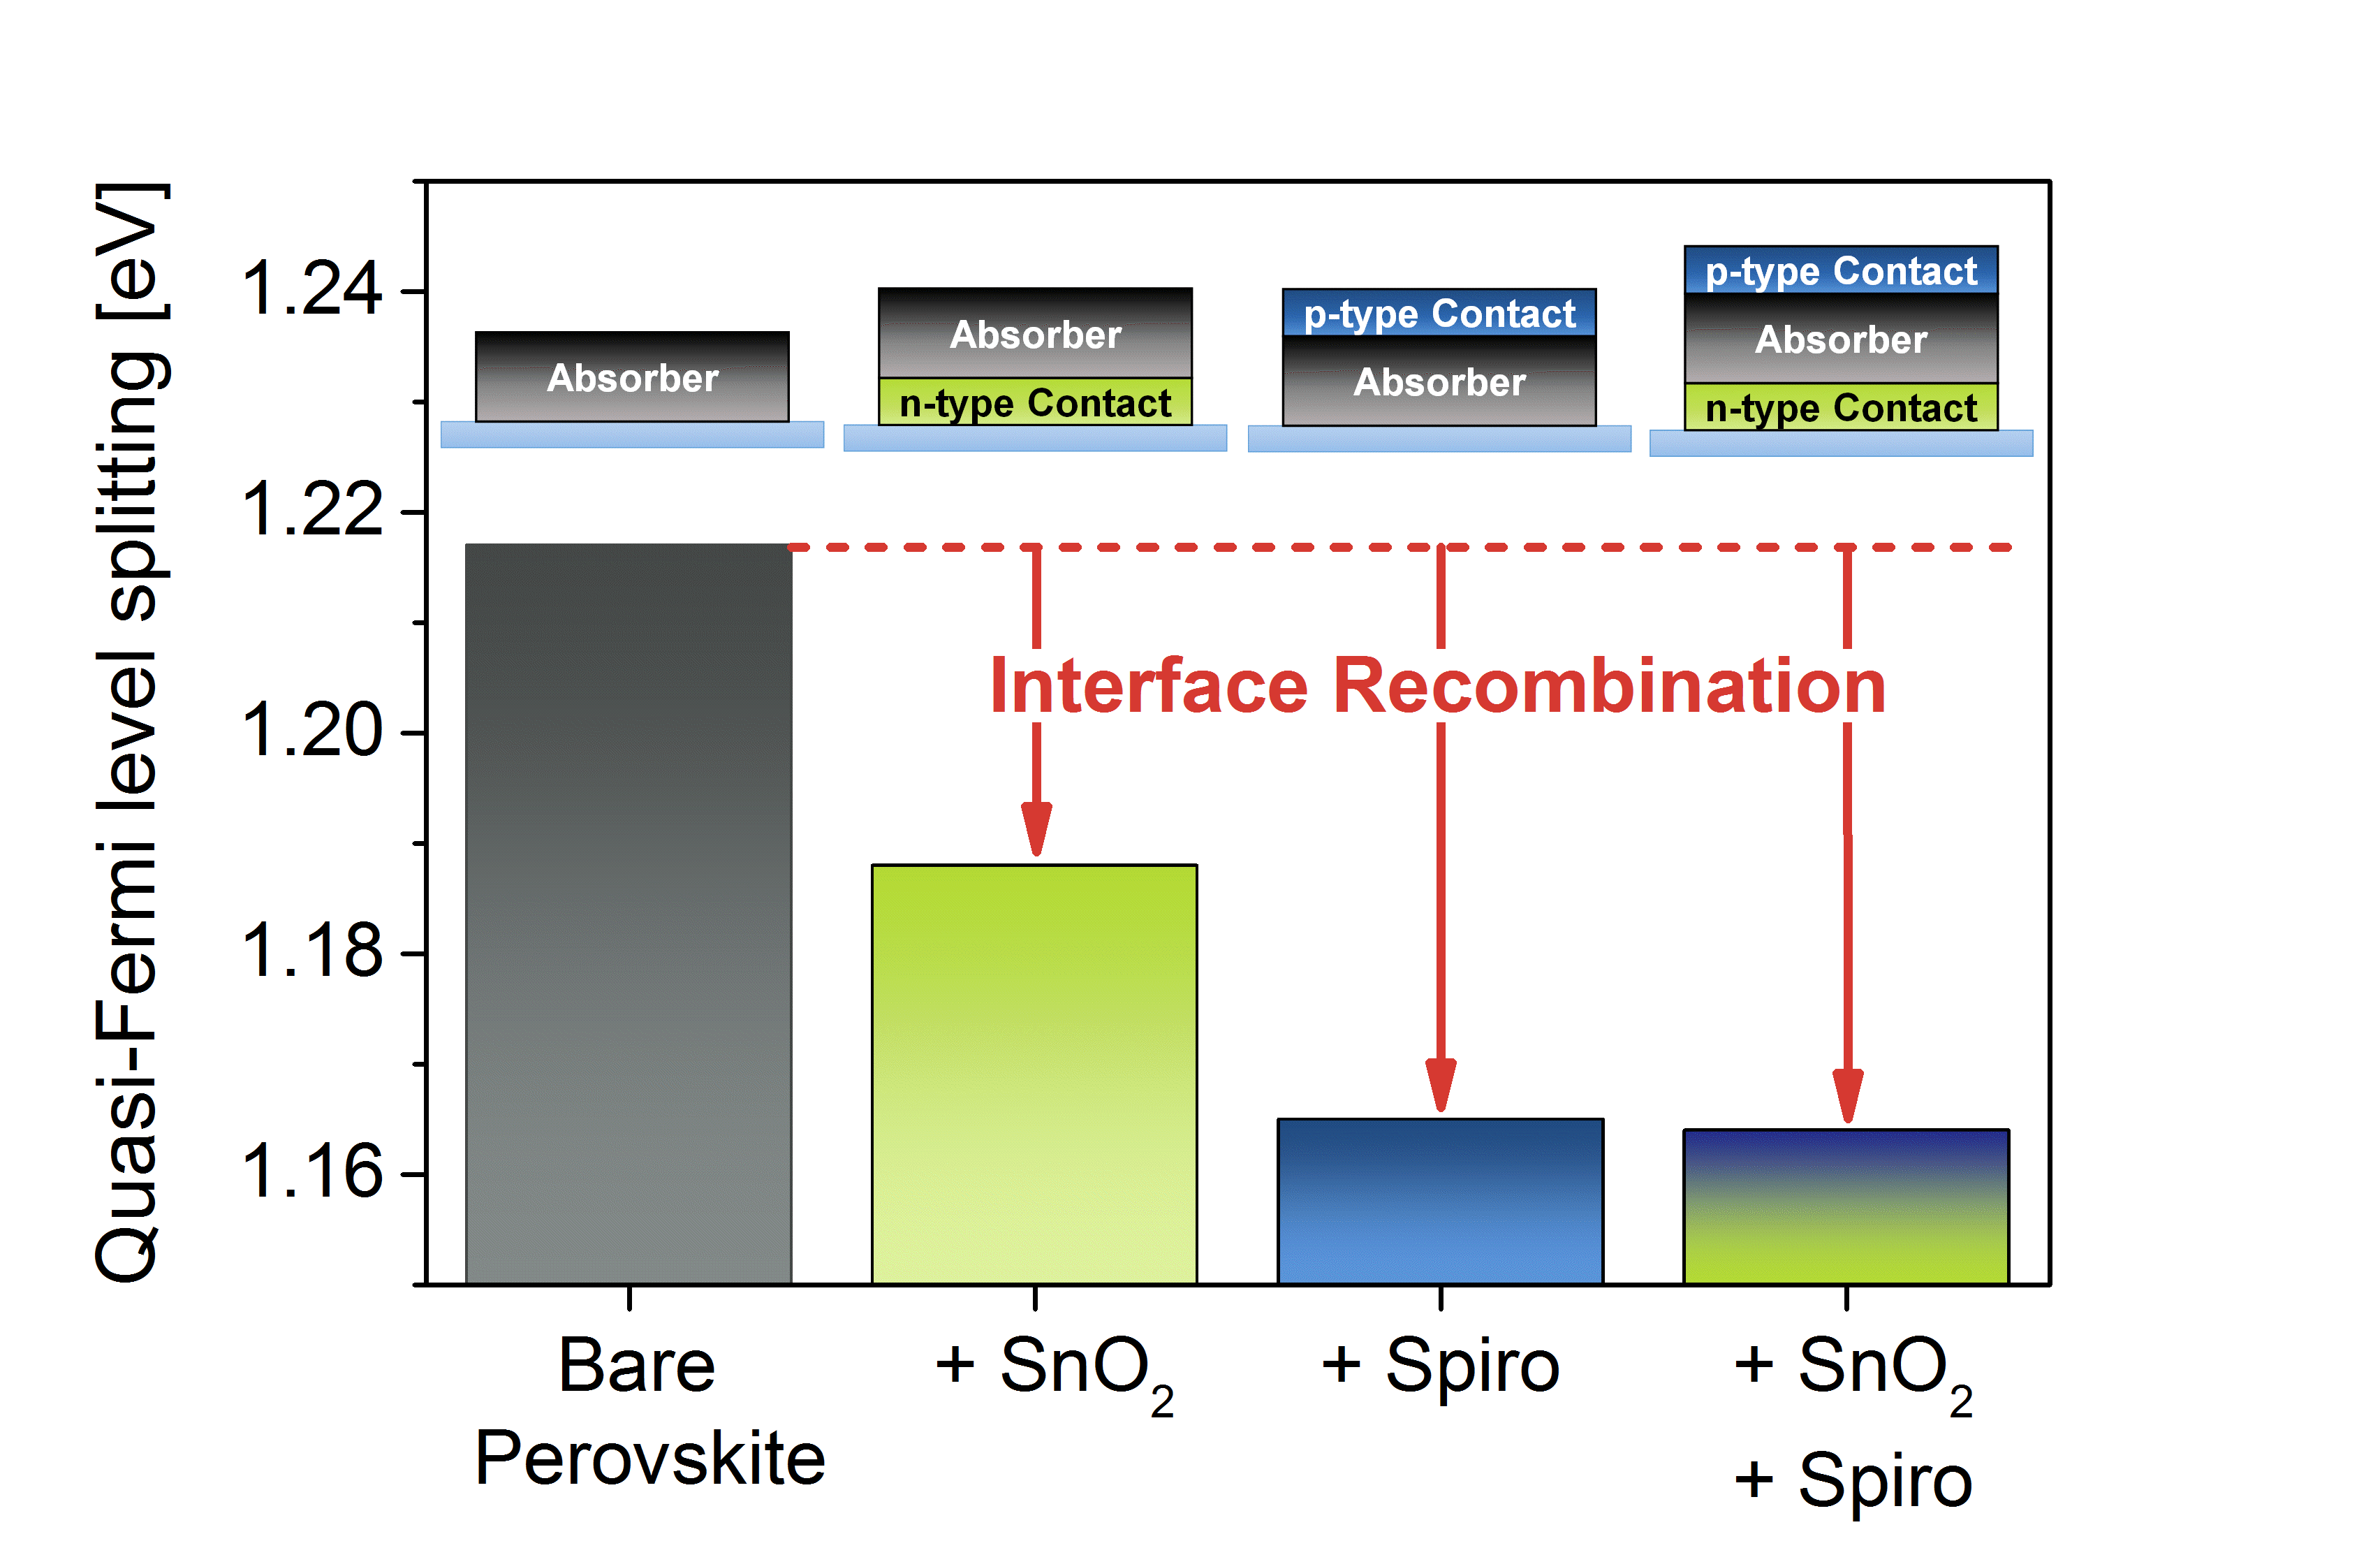
Quantifying bulk and interface recombination losses in semiconductor thin films, layer stacks or complete devices such as solar cells or LEDs. Examples in academic publications can be found in [1–6].
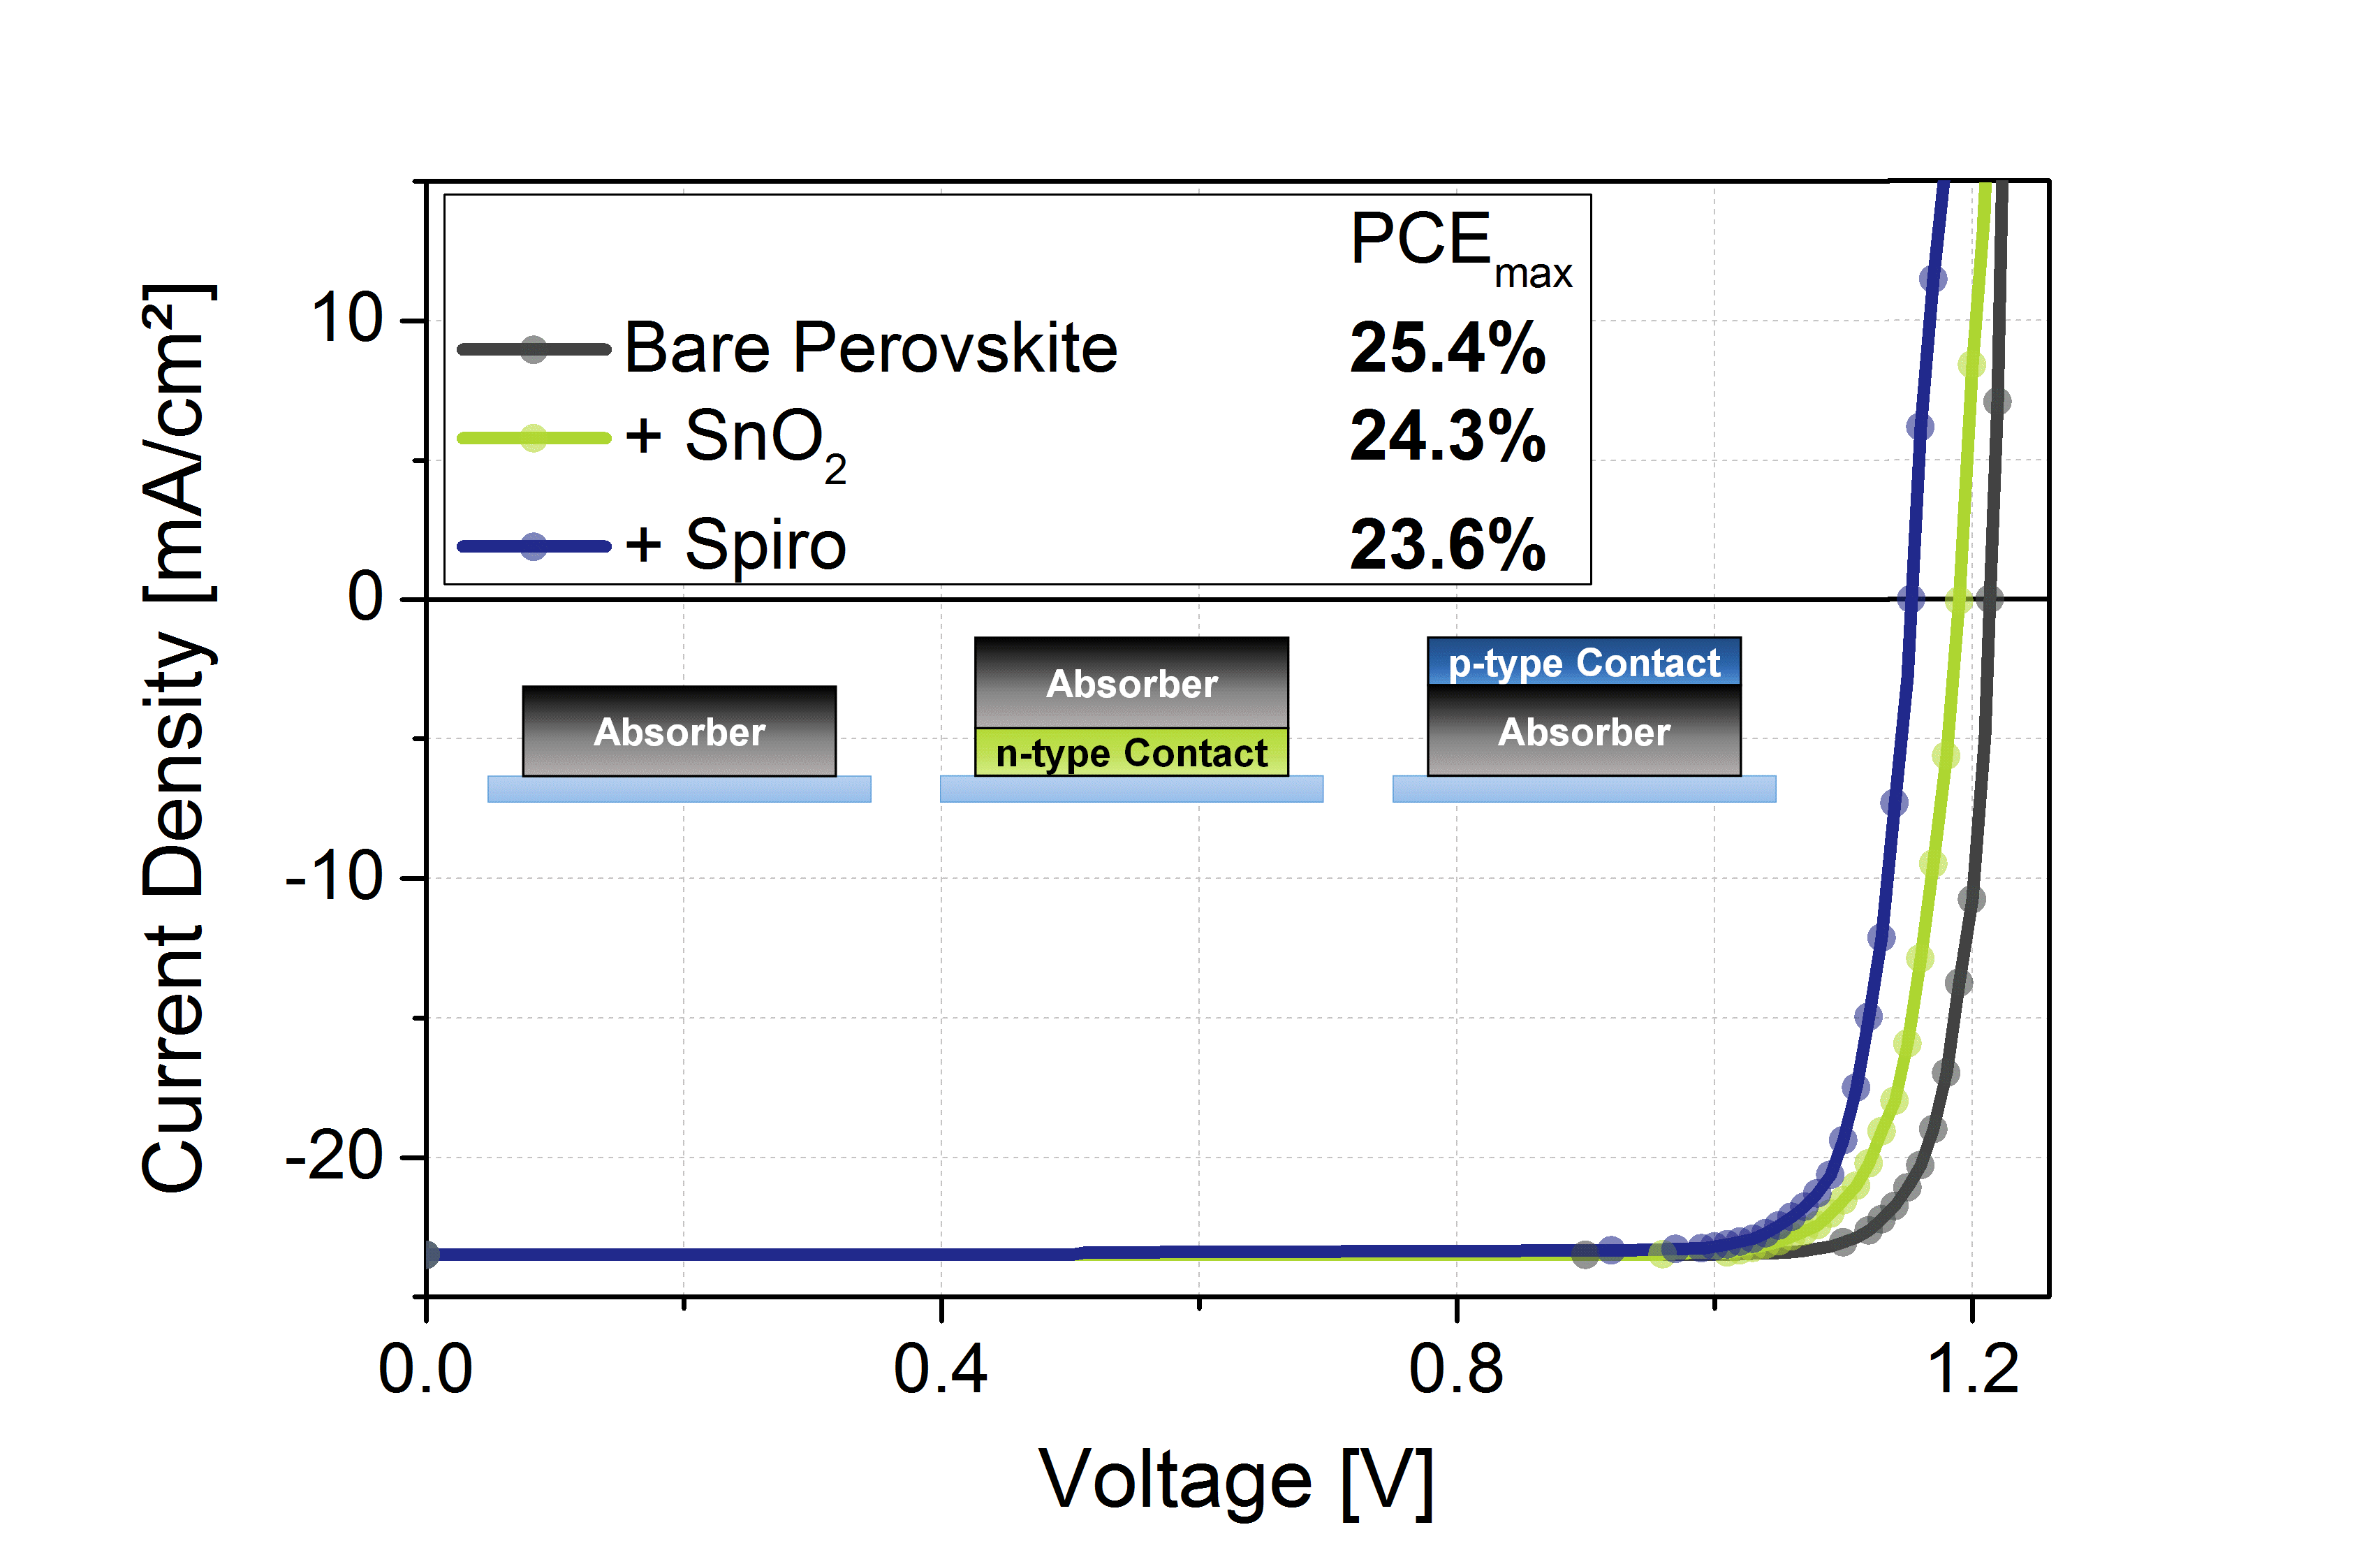
In-depth analysis of efficiency potentials and loss mechanisms in semiconductor thin films, layer stacks or complete devices, for example by determining ideality factors and pseudo-JV curves from intensity- and/or bias-voltage-dependent EL / PLQY and iVOC. See also [7–9].
Scientific references
Recombination analysis
Efficiency analysis
Downloads