


1 · Setup
QYB Lab
One workspace for all QYB measurement data
QYB Lab is a locally deployed web application that brings measurement data from LuQY Pro, LuQY Scanner and LuQY Lifetime into one connected environment. Explore samples and measurements, inspect spatial and spectral data, perform custom analysis and turn results into structured scientific reports.
FROM DATA TO FINDINGS
2 · Explore
Inspect measurements
Browse samples and measurements, explore PL images, heatmaps and spectra, select individual positions and compare results.3 · Analyze
Build any view
Use ready-made analytics or create custom 1D, 2D and 3D plots with flexible axes, filters and data selection.4 · Report
Document findings
Combine Markdown, LaTeX, plots and saved figures into structured scientific reports directly within QYB Lab.Explore Measurements in Context
Explore PL images, quantitative maps, spectra and decay data in one connected dashboard.
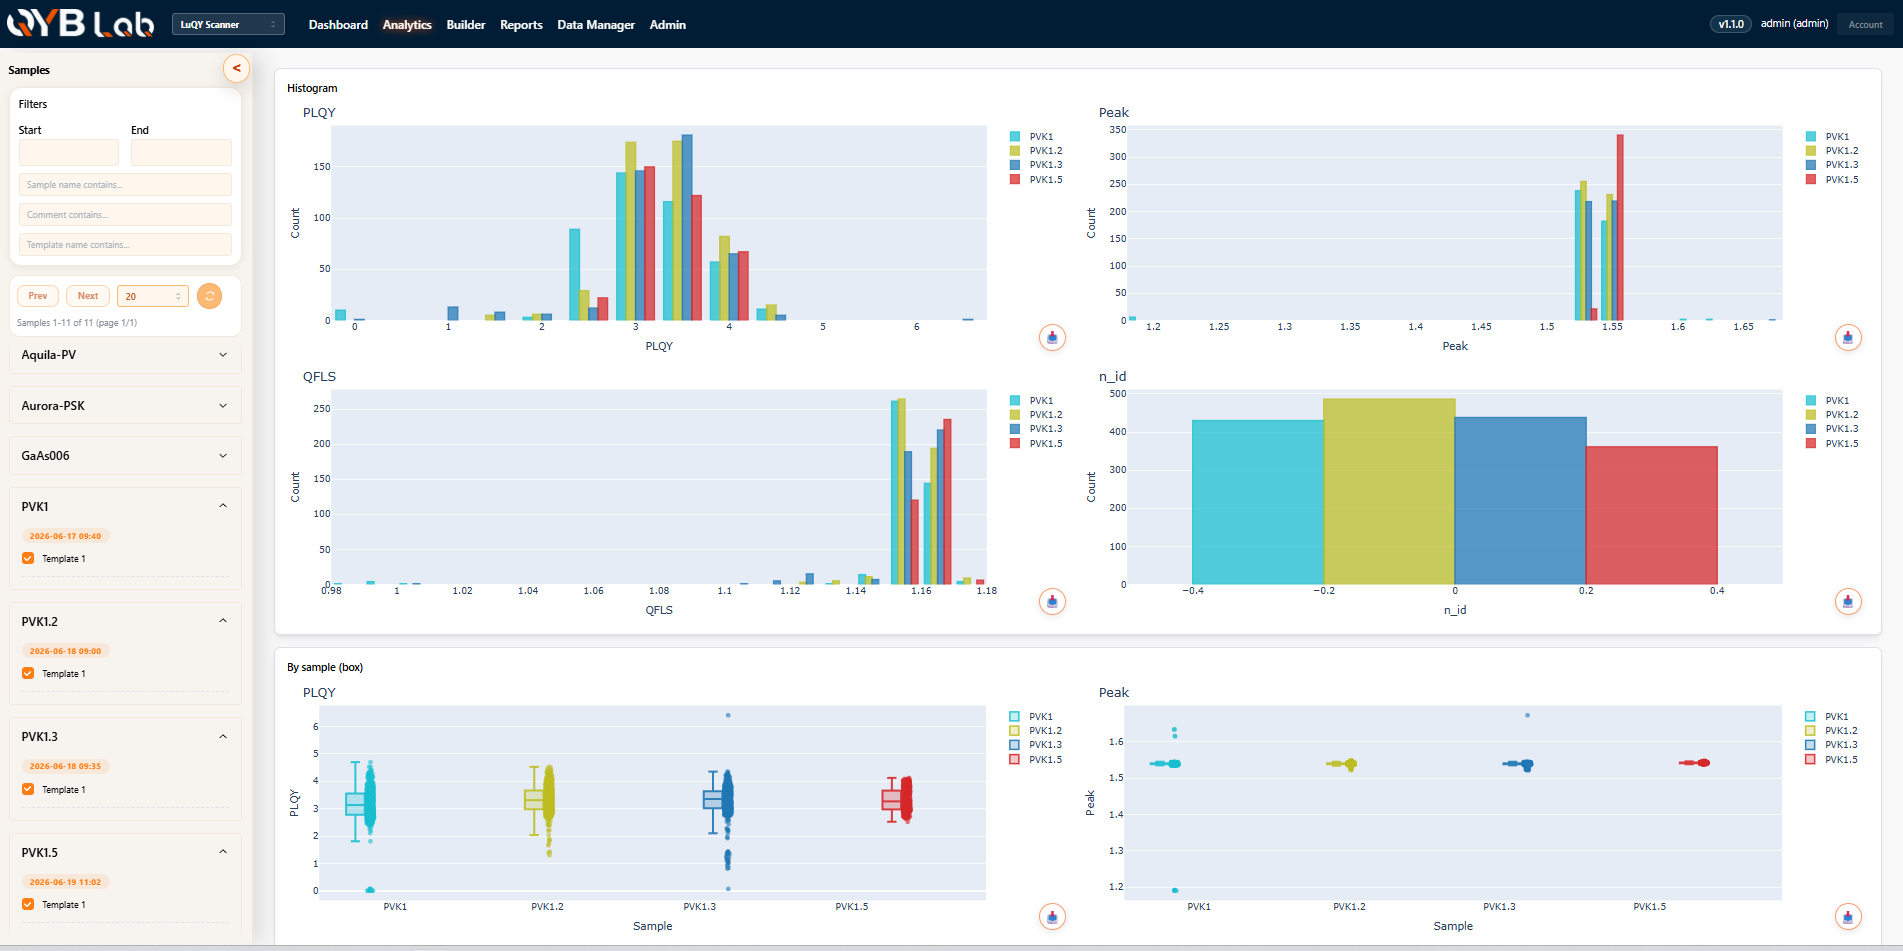
Reveal Patterns Across Your Data
Ready-made histograms and box plots summarize measurements across your datasets, helping you identify outliers, compare distributions and assess performance at a glance.
Build the Plot You Need
Create custom 1D, 2D and 3D visualizations directly from your measurement data. Choose the variables for each axis, apply filters and build multiple plots side by side for flexible, open-ended analysis.
Turn Analysis into a Scientific Report
Combine text, equations and figures in one reporting workspace. Write with Markdown and LaTeX using live preview, and reuse plots and images generated throughout QYB Lab directly in your report.